Complex Pattern Example
Let’s create a mean shift pattern that follows a more complex pattern. For illustrative purposes, let’s choose a combination of cosine and sigmoid functions.
n1 = 10  # 10 sigmoid points
n2 = 20  # 20 cosine points

def sigmoid(z):
  return 1/(1+np.exp(-z))

t1 = np.linspace(-5, 5, n1)  # calculate sigmoid for [-5, 5]
t2 = np.linspace(np.pi/2, 3*np.pi/2, n2)  # calculate cos for [pi/2, 3pi/2]

y = np.concatenate((2*sigmoid(t1),  # combine calculated points into one array
                    2*np.cos(t2)))

plt.figure(figsize=(15,7))
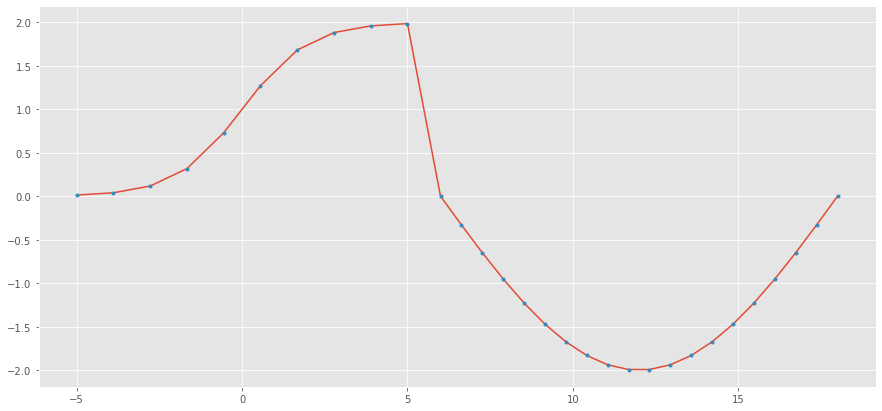
Now that we have an array of points (to later be used as means) let’s plot the results.
t = np.concatenate((t1, t2*12/np.pi))
plt.plot(t, y)
plt.plot(t, y, '.')
Next, let’s use these points to create a mean shift and construct a shift specification DataFrame.
n = n1+n2
mean_list = y
n_obs_list = np.repeat(4, n) # 4 gaussian observations per mean
sd_list = np.repeat(1, n)

specs_df = pd.DataFrame(
            data={
                'mean': mean_list,
                'sd': sd_list,
                'n_obs': n_obs_list
            })
Now we have our mean shift specifications DataFrame prepared:
mean
sd
n_obs
0.013
0.040
0.117
0.317
0.729
1
1
1
1
1
4
4
4
4
4
…
…
…
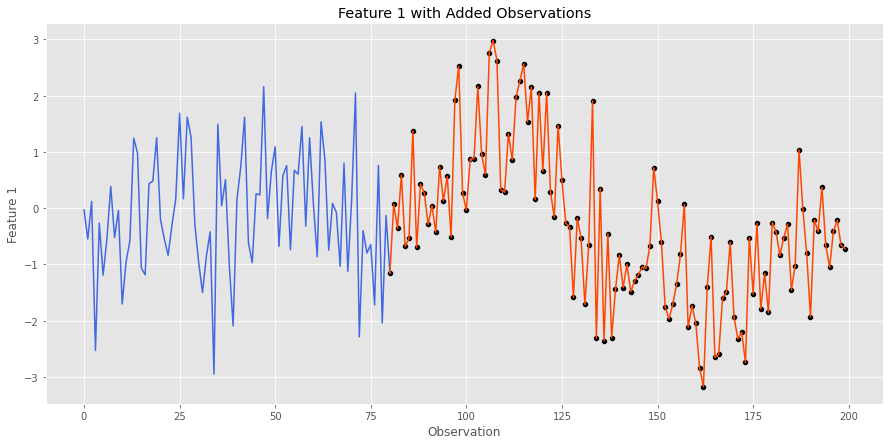
Let’s add the mean-shift pattern to feature 1 and visualize the results with the added observations colored orange/red.
sim.add_gaussian_observations(specs_df, 1, visualize=True)